Note
Click here to download the full example code
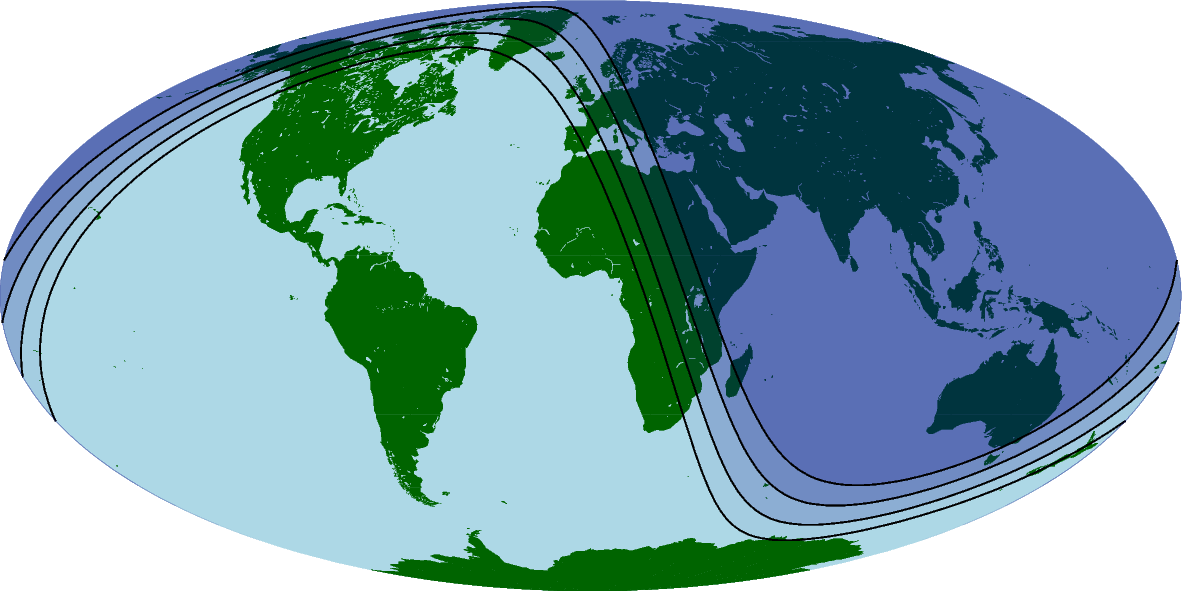
Day-night terminator line and twilights
Use pygmt.Figure.solar to plot the day-night terminator line,
and civil, nautical, astronomical twilights.
Out:
<IPython.core.display.Image object>
import datetime

import pygmt

fig = pygmt.Figure()
# Create a figure showing the global region on a Mollweide projection
# Land color is set to dark green and water color is set to light blue
fig.coast(region="d", projection="W0/15c", land="darkgreen", water="lightblue")
# Set a time for the day-night terminator and twilights, 1700 UTC on January 1, 2000
terminator_datetime = datetime.datetime(
    year=2000, month=1, day=1, hour=17, minute=0, second=0
)
# Set the pen line to be 1p thick
# Set the fill for the night area to be navy blue at different transparency levels
fig.solar(
    terminator="day_night",
    terminator_datetime=terminator_datetime,
    fill="navyblue@95",
    pen="0.5p",
)
fig.solar(
    terminator="civil",
    terminator_datetime=terminator_datetime,
    fill="navyblue@85",
    pen="0.5p",
)
fig.solar(
    terminator="nautical",
    terminator_datetime=terminator_datetime,
    fill="navyblue@80",
    pen="0.5p",
)
fig.solar(
    terminator="astronomical",
    terminator_datetime=terminator_datetime,
    fill="navyblue@80",
    pen="0.5p",
)
fig.show()
Total running time of the script: ( 0 minutes 2.154 seconds)